

Commodities Report - June 2026 Edition
Observations, Graphs, & Institutional-Grade Perspective (Gold & Silver)

Primary Observations
Gold and silver exhibited steep declines for the month of June as various underlying pressures weighed down the prices of precious metals.
Per an ounce of gold, prices fell approximately (-12.0%) month-over-month, down from $4,593.00, to approximately $4,038.00 an ounce at the end of this past month.
Per an ounce of silver, the aforementioned proved to be the more volatile of the pair with prices falling approximately (-21.0%), going from $75.87 at the end of May, down to $59.92 in June.
As it relates to the sharp declines, the drop-off in prices does not appear to be concentrated (solely linked to one variable), rather connected to multiple factors that consist of both macroeconomic and geopolitical concerns.
Declining Prices
Macroeconomic
Economic driven narratives have come into focus in recent weeks as the topic of interest rates continues under the newly appointed Fed chief Kevin Warsh.
According to the minutes of this past FOMC meeting back in June, Fed officials were split on the issue of rate increases. Notwithstanding, the general consensus implies that inflation remains elevated across the board, and if conflict in the Middle East resumes, the increase in oil prices raises the possibility of energy costs that subsequently cascades into core inflation.
As focus continues to shift towards inflation, with the possibility of rate hikes remaining on the table to stabilize economic pressure, the increase in interest rates will negatively impact precious metals. The prospect of higher interest rates typically fuels capital rotation into fixed-income investments which becomes more attractive than staying with precious metals.
Though the most recent (July) CPI figures show weaker-than-expected readings for this past month of 3.5%, prior anticipation of creeping inflation data did likely influence investors, causing them to rotate out of precious metals and into ancillary, less volatile investments that offer guaranteed returns on their money, weighing down prices on gold & silver.
Geopolitical Considerations
The conflicts both in Europe and the Middle East present challenging circumstances, but more so with the latter, whereby the geopolitical fallout has spilled onto precious metals.
Historically speaking, conflicts have usually sparked a flight to safe haven assets, particularly with gold, however, according to an article found in Investing.com, the war with Iran has created a type of crisis that has noticeably impeded capital flows, due to the prolonged closure of the Strait of Hormuz.
Prolonged closure of a major trade artery such as the Strait of Hormuz has wide-ranging consequences. The blockade essentially places a stranglehold on revenue streams for nations within the GCC (Gulf Cooperation Council) which are some of the most reliable buyers of precious metals. As oil-revenues contract, the aforementioned nations have less available funds on hand to purchase precious metals, and in some cases, may even be forced into selling down physical metals to meet fiscal obligations.
At the same time, you have larger nations like China, which is considered to be one of the most significant importers of oil from the Middle East. According to statistics (again, reported in Investing.com), the Chinese conduct significant amounts of trade and import an estimated 40-50% of their oil from the region. A blockade of the Strait of Hormuz creates a trade shock which results in slower growth. As trade surpluses slow for the People’s Republic of China, so does the pace of reserve accumulation for precious metals.
The same could be said for other nations (perhaps to a lesser extent), that as trade surpluses contract (due to closure of a major trade artery) countries are more inclined to slow reserve accumulations which subsequently contributes to pressure on the price of precious metals.
Charts & Analysis
Relative Performance Observations
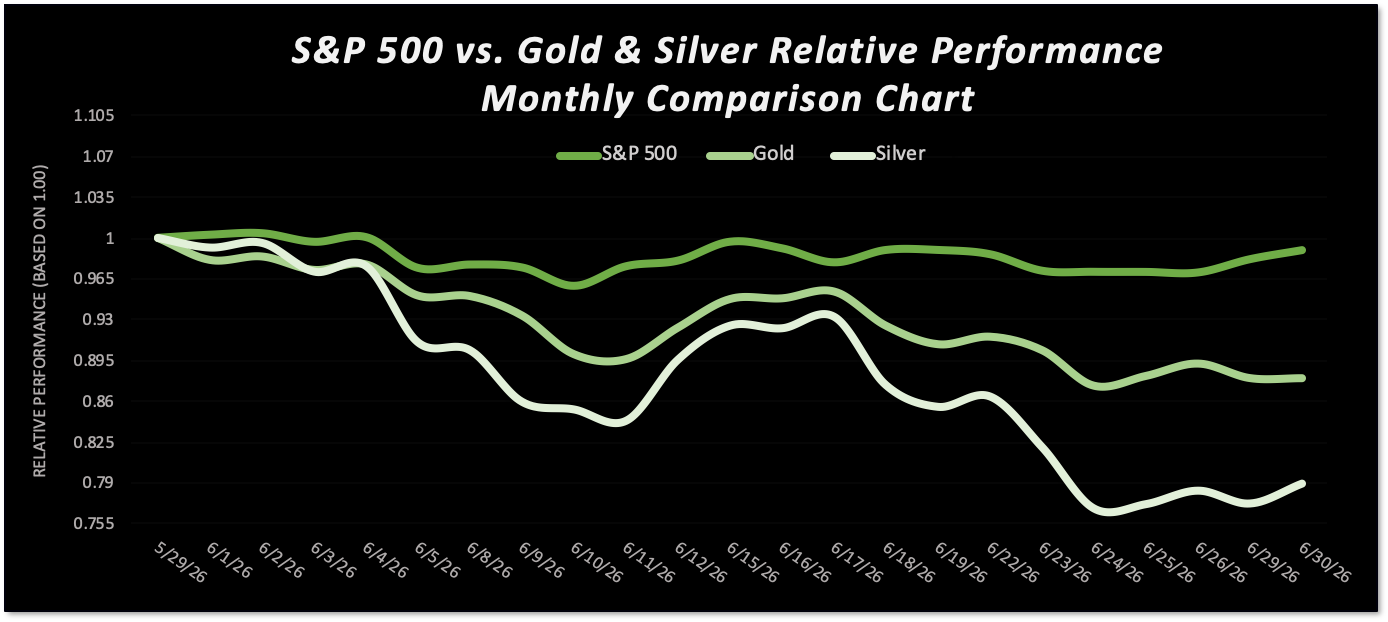
From a more illustrative standpoint, the drop-off in the prices of precious metals (namely gold and silver) are well apparent for the month of June when compared to equities. According to the chart, the S&P 500 remained relatively steady throughout this past month (which actually speaks to the resiliency of the stock market), while both gold and silver were observed as trending sharply lower.
Silver was the worst performing asset class of the trio, falling below its 200-day moving average:
June 9th to approximately $64.00 an ounce, further extending the decline the following day. Based off reports from Yahoo Finance, silver had fallen roughly (-50.0%) from its all-time high.
Gold also exhibited steep declines, however, the trend line in the relative performance graph indicates the drop in prices remains tame compared to silver.
The price of gold, however, did come under pressure and fall below its 200-day moving average:
June 5th, saw the aforementioned trade below the 200-day moving average, falling to $4,365.00 per troy oz.
It should be noted that given silver is the more volatile of the pair, and thus subject to greater price swings, the trend lines are not as stark with gold’s performance.
Notwithstanding, here is what I find particularly very telling about the relative performance chart…
